Field Interactions within Plant Tissue
This article is part of the KF Plasma Times June 2019

Published on: June 2019
Overview of Experiments
- Comparing Daikon Radish grown with Plasma against a shop purchased Daikon Radish
- Daikon Radish grown in the Environment of Plasma Only
- Comparing Cos Lettuce grown with Plasma against a shop purchased Cos Lettuce
A VISUAL REPRESENTATION USING CIRCULAR CHROMATOGRAPHY OF PLANTS GROWN USING GANS
Introduction
This paper is the follow on from “Nutrition in Food – Using GANS and its benefits”
The author’s experience in using the GANS over the last three years is that when you compare produce grown with GANS to produce not grown with any GANS, visually it looks the same and so from a consumer point of view they would not know the difference.
However, from a nutritional point of view the nutrition is higher in the GANS treated radish and the shelf life of the produce lasts a minimum of three or more times longer in your fridge [1]. On visual inspection, the produce grown with GANS can look the same as produce grown without. However other properties have been observed, those being, higher nutrient content as well as longer shelf life. Therefore, it was investigated whether the method of using the circular chromatography could be used to visually show these properties in produce grown with the GANS.
Ehrenfried Pfeiffer had originally developed this method to evaluate the life in soils. A quick and easy test to determine how healthy your soils are. It’s a way of assessing your soil for humus, minerals, microbiology and more. Most of the work was done to analyze soils, with less analysis done on plant materials. The analysis is not an exact science, but rather an interpretation by the observer.
The purpose of Circular Chromatography is to allow the separation of the different organic
components that make up the plant matter or soils that are tested. The separation of layers is from the centre to the outer edges of your filter paper. By using Silver Nitrate, you are essentially taking a photograph of the essence of the plant in its interaction with the Silver Nitrate. This interaction is visually shown with different patterns and colours that develop on the filter paper as it is exposed to the light.
Materials and Method Used
Prepare a solution of Silver Nitrate
Mix 0.5grams of Silver Nitrate in 100ml of distilled water.
Preparation of circular filter paper
Place a 2mm diameter hole in the center of your circular filter paper. Cut a 2cm by 2cm square piece of filter paper and roll. This becomes your wick. Place the wick in the hole in the center of your filter paper. Allow the wick to stand in the solution of silver Nitrate – as depicted in Fig 1.
Through capillary action the solution is absorbed through the wick and spreads out in a circular pattern. Allow the Silver Nitrate to spread to a radius of 4cm. Remove the wick and allow the paper to dry.
Preparation of Plant Material for testing
Add 0.5 grams of NaOH into 500mL of distilled water - Fig 2.
Weigh 50 grams of plant material (Fig 3).Pour the 500mL of the weak caustic solution into the jar containing the plant material. Use a stick blender for several minutes to break down the plant material.
The plant material after mixing with the caustic solution is shown in Fig 4. Let this solution sit for 1hour before using.
Creating the Chromatograph
Place a new wick into the centre of your filter
paper that was imbued with the Silver Nitrate. Place this over a small dish containing the plant mixture, ensuring the wick sits in the solution to allow the wicking of the plant solution - as in Fig. 5 & 6.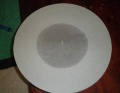
Fig 1. Wicking of filter paper with Silver Nitrate.
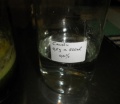
Fig 2. Bottle containing caustic solution.
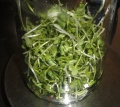
Fig 3. Bottle containing 50 grams of radish plant material.
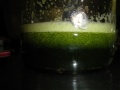
Fig 4. Bottle containing caustic solution and plant material.
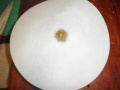
Fig 5. Filter paper in plant solution.
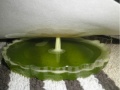
Fig 6. Filter paper in plant solution.
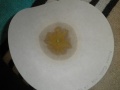
Fig 7. Spreading of plant solution from centre out.
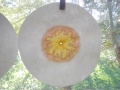
Fig 8. Filter paper drying.


Allow the plant solution to spread to the 4cm radius mark on your paper (Fig 7). This may take up to 30 minutes.
Remove the wick and allow the paper to dry in
indirect sunlight – see Fig 8. The drying can take several days.
The Chroma’s have been made ready for analysis and interpretation.
Plasma Science understanding of this technique and how it can be applied to visually determine the health of the food and the nutritional quality of the food that is grown.
Plasma understanding teaches that to create a Nano-layer on copper plates, it needs to be exposed to a caustic environment (NaOH). This sodium (Na), environment allows the Magnetical and Gravitational fields of the copper to open up, creating a space gap between each atom, thereby creating the Nano-layers. Using these plates in another salt environment (NaCl) allows the Nano copper to open more and become a GANS or plasma of copper. This same principal is applied to this method. The plant is already in a GANS state. The structure of the plant, the different amino acids, proteins, plant sap are all held together by the interaction of the Magnetical and Gravitational fields of the different plasmas. By blending the plant to break it down and exposing the plant material to the weak caustic environment in the solution, the bonding between these different proteins, amino acids and cells is weakened. When this solution wicks up and spread out across the filter paper, it will expose the different components and their Magnetical and Gravitational field strengths – exemplary graphical explanation in Fig 9.
The center zone will show the higher MaGrav strength of the different elements and minerals contained in the plant. The middle zone will show the proteins, vitamins, amino acids. The outer zone displays the integrity, overall health, vitality and strength of the plant.
Another way to interpret the Chromatograph is to view the different layers from the center to the outer layer as different layers of Magnetical and Gravitational field strengths- see Fig 10. As the plant solution moves through the filter paper, the elements and minerals having a stronger MaGrav field strength are your first rings and as these stronger MaGrav fields then repel the weaker amino acids and proteins further out from the center.
The same principals when looking at the cross section of a tree trunk is depicted in Fig 11. Figure 12 shows the rings of different MaGrav field strengths within the structure of the root.
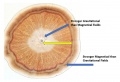
Fig 9. Chromatograph showing changes in MaGrav field strengths from the centre out.
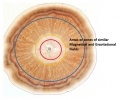
Fig 10. Chromatograph with different zones of similar MaGrav field strengths.
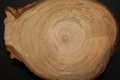
Fig 11. Rings on a cross-section of a tree trunk.

Fig 12. Microscopic image of the root of an orchid plant.


Comparing Daikon Radish grown with Plasma against a shop purchased Daikon Radish
In the paper “Nutrition in Food – Using GANS and its benefits” Ref 1 the Daikon Radish seeds was soaked in the GANS plasma solution for 24 hours. The plants grew for 8 days and harvested. Part of the sample was sent to a laboratory for analysis and another part was kept to produce the Chromatograph images.
To compare these images to Daikon Radish seeds that had not been soaked in the GANS, nor were grown in a plasma environment, Daikon Radish shoots were purchased from another producer.
The objective of performing the Chroma’s on the Radish samples was to determine if the images produced showed any marked differences. Previous experiences of growing with GANS shows that when a direct visual comparison is made, one cannot determine any significant difference between plant grown with GANS and those without. Laboratory results have shown that the mineral content differs, and a significant extension of the shelf life has been observed. Ref 1 Therefore, is was investigated whether this method of using the chromatograph could be used to visually show the properties of the plant having higher nutritional values and longer shelf life.
Both batches of plant material were prepared as explained in the Materials and Method section. The following set of images were produced. The two images in Fig. 13 & 14 were produced from the different plant solutions after 1 hour. Allowing the NaOH to break open the different structures of the plant. A marked difference between the Shop radish (Fig 13) and the Plasma Radish (Fig 14) can be seen.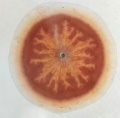
Fig 13. Shop Radish.
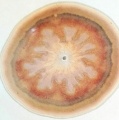
Fig 14. Plasma Radish.
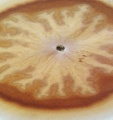
Fig 15. Close-up image of the Shop radish.
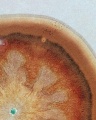
Fig 16. Close-up image of the Plasma Radish.
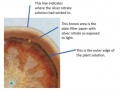
Fig 17. Explaining the chromatograph.
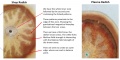
Fig 18. Analyzing the Shop Radish with the Plasma radish as reference.


Figure 17 details the different outer layers and what they indicate. The outer line is where the silver nitrate solution had wicked to, on the filter paper. The outer brown area is the silver nitrate exposed to the light. The third ring is where the plant solution had wicked to on the filter paper.
From the chromo images in Fig. 18 & 19, the difference between the plasma radish when compared to the shop radish is clearly visible. There are more distinct layers in the plasma radish indicating stronger defined areas of field strengths. Both plant solutions were soaked in the weak caustic environment.
The various components in the shop radish seems to have been broken down, opened-up gravitational magnetically very quickly in the caustic environment. The mixed white brown area has spread out almost to the outer edges, while in the plasma radish this area seems to have been contained in the second circle, still inner zone area (Fig 19). As the gravitational magnetical field strength of the various components of the plasma radish have a higher field strength they were not opened-up by the caustic environment. This is why we see more defined areas, more layers. The outer boundary area in the plasma radish is more distinct and defined, indicating a strong gravitational magnetic field of the plant as a whole. This indicates why we have a longer shelf life from the plasma radish.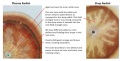
Fig 19. Analyzing the Plasma Radish with the Shop radish as reference.
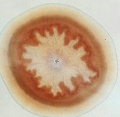
Fig 20. Chromatograph of radish grown in environment of GANS.
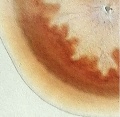
Fig 21. Close-up image of the radish grown in the environment of GANS.


Daikon Radish grown in the Environment of Plasma Only
In this experiment the Daikon Radish was grown in an environment which contains GANS. They grew 1.5 meters away from plants that had been treated with the GANS. No GANS was added to the seeds or the plants during the 8 days of growth.
This experiment was to determine whether the radish plants grown in an environment of GANS only would show any visual changes in the chromatograph. Figures 20 & 21 shows the chromo image produced from this radish.
In comparing all three radishes (Fig. 22), the following features stand out:

1. Border area clearly defined in the plasma radish is still noticeable in the environment radish and less so in the shop radish.
2. The white structure with the forks in the environment radish is more defined and seems to hold together better than the shop radish.
3. The plasma radish seems to have a well-defined pattern, higher integrity, higher strength and vitality.
Comparing Cos Lettuce grown with Plasma against a shop purchased Cos Lettuce
In this experiment a Cos lettuce that had grown in water containing bottles of plasma was used. The seeds were not soaked in the GANS as they are too small. The seedlings were watered with the GANS while they grew in the seeding trays. A Cos lettuce was purchased from the local shop to use as a comparison.
Fig 23. Chromatographs of Shop cos lettuce.
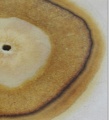
Fig 24. Chromatographs of GANS Cos lettuce.
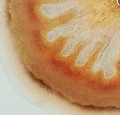
Fig 25. Close-up view of Shop cos lettuce.
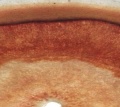
Fig 26. Close-up view of GANS Cos lettuce.


Analysis of Results
The images in Fig. 27 & 28 are very distinct from each other and one would assume that they are not of the same plant variety.
The plant material was left in the caustic solution for 3 days before doing another chromo image. This allowed more time for the caustic environment to open-up the structures of the lettuces.
The images in Fig. 29 & 30 were produced after allowing the plant solutions to soak in the caustic solution for 3 days.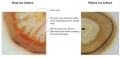
Fig 27. Analysis of shop cos lettuce with the plasma cos as reference.
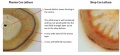
Fig 28. Analysis of the plasma cos lettuce with the shop cos as reference.
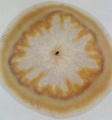
Fig 29. Chromatographs of shop cos lettuce.

Fig 30. Chromatographs of Plasma cos lettuce.


Evaluation of Purchased Cos Lettuce
Almost no difference between the 1h and 3-day images – as visible in Fig. 31 & 32. The MaGrav field strength of the plant structure was initially weak, so the caustic environment was able to weaken these bonding’s within the first hour.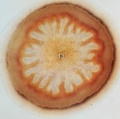
Fig 31. Shop cos – 1 hour.
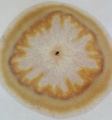
Fig 32. Shop cos – 3 days.
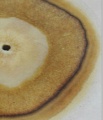
Fig 33. Plasma cos – 1 hour.
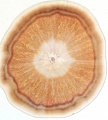
Fig 34. Plasma cos – 3 days.


Evaluation of Plasma Cos Lettuce
The difference between the 1h and 3day is quite distinct - see Fig. 33 & 34. It appears that the structure and detail in the 3day image has opened up. The extra time allowing the layers to separate more so we can see more of them.
Comparing the outer bands between the Purchased Cos and the Plasma Cos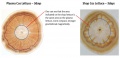
Fig 35. Comparing the image of the plasma cos with the shop lettuce.
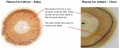
Fig 36. Comparing the image of the plasma cos with the shop lettuce.

Fig 37. Shop cos lettuce (left). Fig. 38. Plasma cos lettuce (right).


A distinctive outer ring, band in the Plasma Cos (Fig 38) compared to the shop lettuce (Fig 37) indicates the integrity and strength of the plant. The Magnetical and Gravitational field strength of the cells, amino acids, proteins remain intact and are not opened-up by the weaker NaOH solution.

In the Shop Cos we do not see a well-defined boundary, meaning the MaGrav strength of the individual components were weaker and were affected by the NaOH solution. We also see a greater amount of detail as the plant structure was broken down by the caustic. As there was no change in the Shop Cos from 1h to 3 days, this indicates that the NaOH environment had opened the structures of the plant very quickly, implying a poor and shorter shelf life.
Overall the Plasma Cos lettuce looks well contained, a strong MaGrav field strength which then leads to a longer shelf life.
Overall Analysis and Observations
In both the Daikon Radish and the Cos Lettuce experiments we can clearly see a marked difference in the structures of the produce grown with the GANS compared to the produce grown without. Produce grown with the GANS creates a very defined border, which indicates strong health and vitality. Plants which have a stronger Gravitational Magnetic Field strength can account for the higher nutrition and shelf life.

The overall images produced by the Radish and Cos grown with the GANS (Fig 39 and 40) show a uniform structure and order. These images may possibly also indicate the Emotional state of the plants. As in the work done by Masaru Emoto [2] on freezing water and showing the different crystalline formations of a person’s emotion, maybe these chroma images are giving us a glimpse into the Emotional state of the plant world.
Are we growing Emotional balanced plants using the GANS and this Emotional balance creates plants with higher nutritional levels? The plants are happy to give and be the best they can be.
Further study and analysis are needed to identify the various layers as to what they represent such as mineral, which proteins or amino acids. The work undertaken in these experiments and the interpretation using the principals and my understanding of the Plasma Science and
Technology may or may not lead to further work in this direction. The images of the produce grown with GANS certainly tell a story, how we interpret that story needs more work.
An interesting observation is noticed in the different plants solutions originally made with the caustic solution. The bottles of each solution were left for several weeks.
In both the Plasma Radish and the radish grown in the plasma environment (labelled normal radish), as depicted in Fig 41- the plant mixture sank to the bottom leaving a dark green liquid layer on top.
The shop radish (bottle on left) did not sink but all floated to the top, leaving a clear liquid at the bottom. See Fig 41, bottle on left. Mould began to grow on top and the smell from this bottle is rather putrid. No real smell from either of the other two bottles.

This again shows how the produce grown with GANS or even in the environment retains its integrity and vitality.
References
- MacDonald, J., Nutrition in Food – Using GANS and its benefits. KF Plasma Times, June 2019.
- Wikipedia contributors, Masaru Emoto, Wikipedia, The Free Encyclopedia, https://en.wikipedia.org/w/index.php?title=Masaru_Emoto&oldid=896924091 (accessed May 22, 2019).